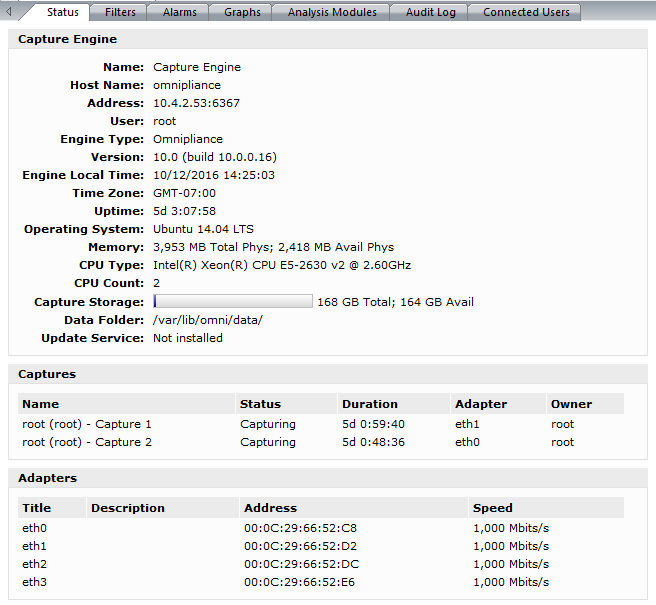
Capture Engine details windows
A Capture Engine details window displays status information about the Capture Engine and lists the filter, alarm, and graph settings that can be distributed from the Capture Engine to other Capture Engines using the Capture Engine Manager. A Capture Engine details window can have the following tabs: Status, Filters, Alarms, Graphs, Analysis Modules, and Audit Log and Connected Users.

• The Status tab displays details about the connected Capture Engine. It includes the Name, IP Address and Port configured for the Capture Engine, User, product and file Version for the Capture Engine, and whether or not the Update Service is running.
• Captures: Shows all the captures defined for the Capture Engine, including the Name, Status (Capturing or Idle), Duration, Adapter it is using, and the Owner.
• Adapters: Shows all the adapters available to the Capture Engine, including the Title, Description, physical Address, and the network Speed.
TIP: To print the Status tab of a Capture Engine window, make it the active window and choose > .
• The Filters tab lists all the filters defined for the Capture Engine
• The Graphs tab lists all the remote graph templates defined for the Capture Engine
• The Analysis Modules tab displays summary information about each analysis module installed on the Capture Engine
• The Audit Log tab lists all available information regarding events taking place on the Capture Engine. You can go to the first and last page of the log, and you can search the log.
• The Connected Users tab lists all users currently connected to the Capture Engine. Click to refresh the list.
You can distribute settings from the Filters, Alarms, and Graphs tabs to other Capture Engines. For details, see Updating Capture Engine settings.